Dashboard
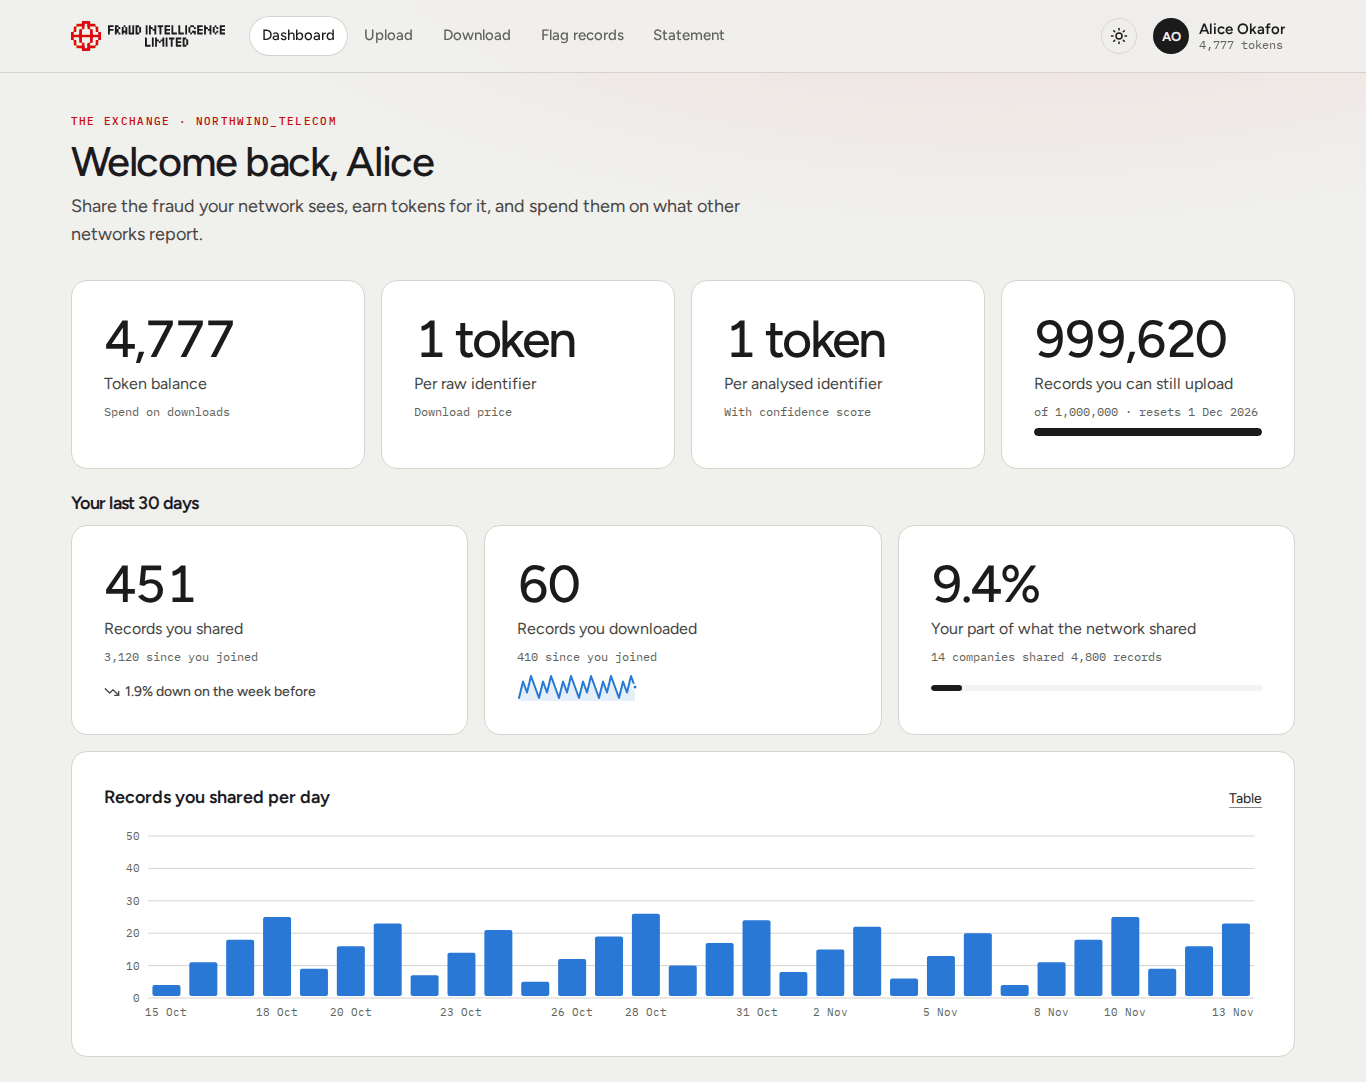
The dashboard is the first page after sign-in. It shows your company's balance and prices, what the company did in the last 30 days, and shortcuts to the main actions.
The line above the greeting reads "The Exchange" followed by your company ID. Other members see this ID next to the records you upload.
All figures are for your company as a whole, not for you alone.
Waiting for approval
Until Fraud Intelligence Limited approves your account, the dashboard shows "Your account is waiting for approval". You see the summary cards, the action buttons are disabled, and the activity and statistics sections are hidden. See Registration.
Summary cards
| Card | What it shows |
|---|---|
| Token balance | The tokens your company can spend on downloads. Shared by all users of the company. |
| Per identifier | The download price of one identifier, in tokens. |
| Records you can still upload | What is left of your company's upload limit for the current period, in records. The line below shows the full limit and the date it resets. The bar shows the part that is left. |
The upload limit is counted in records stored, belongs to the company, and resets in full at the end of each period. See Uploading fraud data and Tokens, rewards and limits.
Your last 30 days
| Figure | Meaning |
|---|---|
| Records you shared | Records your company uploaded in the last 30 days. Below it: the total since the company joined, and the change of the last 7 days against the 7 days before, as "up" or "down" in percent. |
| Records you downloaded | Records your company bought in the last 30 days, with the total since the company joined and a small line chart of downloads per day. |
| Your part of what the network shared | Your company's share of all records uploaded by all members in the last 30 days, in percent. Below it: how many companies shared, and how many records they shared together. |
Below the figures, the chart Records you shared per day has one bar for each of the last 30 days. Table shows the same figures as a table. The chart appears once your company has uploaded or downloaded something.
If the section says the figures are being rebuilt, they can be partial for a few minutes.
Statistics
| Card | Meaning |
|---|---|
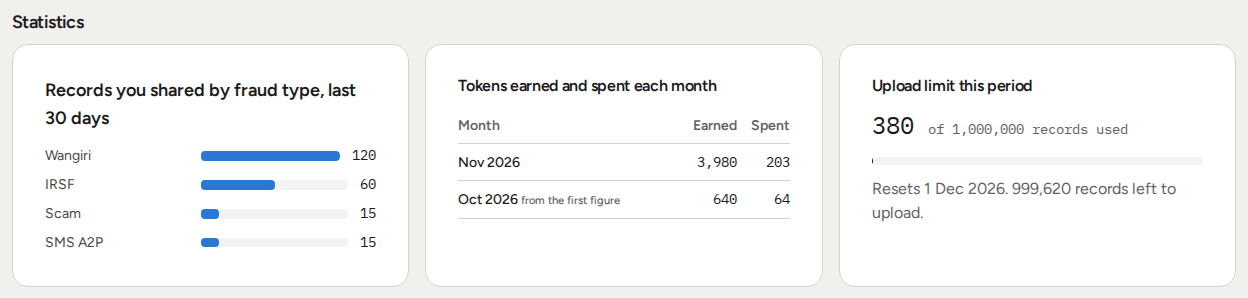
| Records you shared by fraud type, last 30 days | One bar per fraud type, largest first. Shows where your uploads went. If the company uploaded nothing in the period, the card says so. |
| Tokens earned and spent each month | A table with Month, Earned and Spent for up to six months that had any movement, latest first. A month marked "from the first figure" is not a whole month: the figures start inside it. |
| Upload limit this period | How many records of the upload limit are used, out of the total, with a bar. Below it: the date the limit resets and how many records are left to upload. |
The monthly table counts the same movements as the Statement, where you can see each one.
No tokens
If your company is approved and its balance is zero, the dashboard shows "You have no tokens, so you cannot download yet", with the reward per identifier and the button Upload fraud data.
Actions
| Card | Buttons |
|---|---|
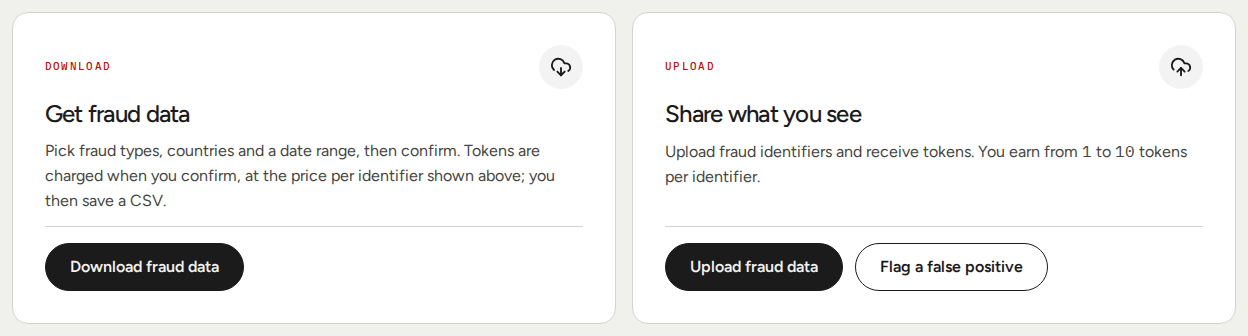
| Get fraud data | Download fraud data opens Downloading fraud data. Tokens are charged when you confirm a download, at the prices shown in the summary cards. |
| Share what you see | Upload fraud data opens Uploading fraud data. Flag a false positive opens Flagging records. The card also shows the lowest and highest reward per identifier for your company: from 1 token, for a record uploaded for another company as its source, to 10 tokens. |